Detailed Acceleration in GTA 3 & Vice City Handling
A heavy vehicle is given more power by the game than a light vehicle with the same Engine Acceleration rate. This is why some heavy trucks can reach a higher top speeds than the light sports cars.
Experiments
For this experiment I used the flat motorway in my Curveshire landscape for GTA 3 with Ghost_Master2000’s speedometer mission code. I used the Stinger but I changed the handling so that there would be no wheelspin and no 1G_BOOST or 2G_BOOST.
The handling line I used is here, with Engine Acceleration set in bold:
STINGER 1000.0 1.9 4.7 1.5 0.0 0.00 -0.30 50 1.00 1.00 0.50 5 400.0 20.0 4 P 1.00 0.50 0 20.0 1.50 0.135 0.25 1.00 35000 0.25 -0.15 0.50 2180 1 1Experiment 1: Top Speed
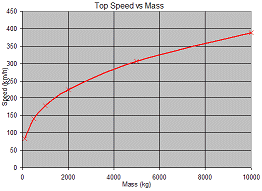
I used a range of Mass values but no other settings were changed. I measured the top speed as the speed reached before the motorway ended, which is about 1km. My results from this experiment are shown in this graph:
This is a really surprising set of results because it shows that Mass actually has a huge impact on top speed. From the other experiments I have carried out I have realised this is because the Engine Acceleration value is absolute. This means that whatever Mass the vehicle has, it will always accelerate at the rate given by the Engine Acceleration value. Heavy vehicles with the same Engine Acceleration as small vehicles are therefore given more power and this allows them to fight off the friction forces to get higher top speeds.
To give an example, say we have a sports car with a Mass of 1000, a family car with a Mass of 1500 and a muscle car with a mass of 2000. If we gave them all an Engine Acceleration of 20 they would reach top speeds of about 175km/h, 200km/h and 225km/h respectively. The muscle car would have a top speed about 50km/h higher even though it had the same Engine Acceleration. This is a big problem because it makes it very difficult to give light sports cars a higher top speed than heavy muscle cars without using silly Engine Acceleration values.
Experiment 2: Rolling Friction
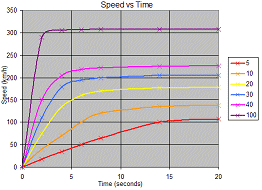
For this experiment I used the same motorway and the same speedometer code. I used the Stinger again with the handling line shown above. I measured the speed at intervals of the vehicle whilst accelerating from a standing start. The Engine Acceleration values I ran the experiment with are shown in the Legend of the graph. I then used the results to plot these acceleration curves:
Here we see the very sharp kink in the acceleration curve. It seems that the drag starts off quite low, gets a little greater, then suddenly becomes massive and stops any further acceleration. In reality drag gradually builds up, totally unlike these tests in GTA 3. Note that bigger Engine Acceleration values have a sharper kink in their curve.
Experiment 3: Boost Flags
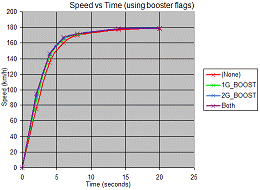
I the same handling line again for this experiment. I did a rolling friction type experiment with an Engine Acceleration of 20, then I enabled the 1G_BOOST and ran the experiment again. I then enabled the 2G_BOOST flag instead and ran the experiment a third time. Finally, I ran the experiment with both the flags set:
The statistics show that these boosts do not have much effect on the actual rate of acceleration, which surprised me. However, they behave differently when going up hills. A vehicle with one or both the boost flags enabled will be able to climb very steep hills because the boost is not constant; it gives the car a really big push when it slows right down to get it back up to speed. More specifically, when the vehicle shows to around 25km/h the boost will shunt the car up to around 50km/h very quickly.
The results show the booster flags only effect the rate of acceleration at very low speeds. The effect is much stronger in GTA 3, probably because it is more hillly.
Notes
I tested some other things I had suspected and found these interesting facts:
- The Top Speed setting does nothing to effect top speed.
- The NumberOfGears setting has no effect on top speed or acceleration.
- The rate of acceleration does not change when the car has wheelspin.
- The rate of acceleration only changes when going uphill or downhill.


